As I am interested in radio telecommunication, I thought that Software-Defined Radio was a good start to begin learning.
For this I went with the RTL-SDR V3 and its antenna kit.
I first listened to the FM band using the software SDR++.
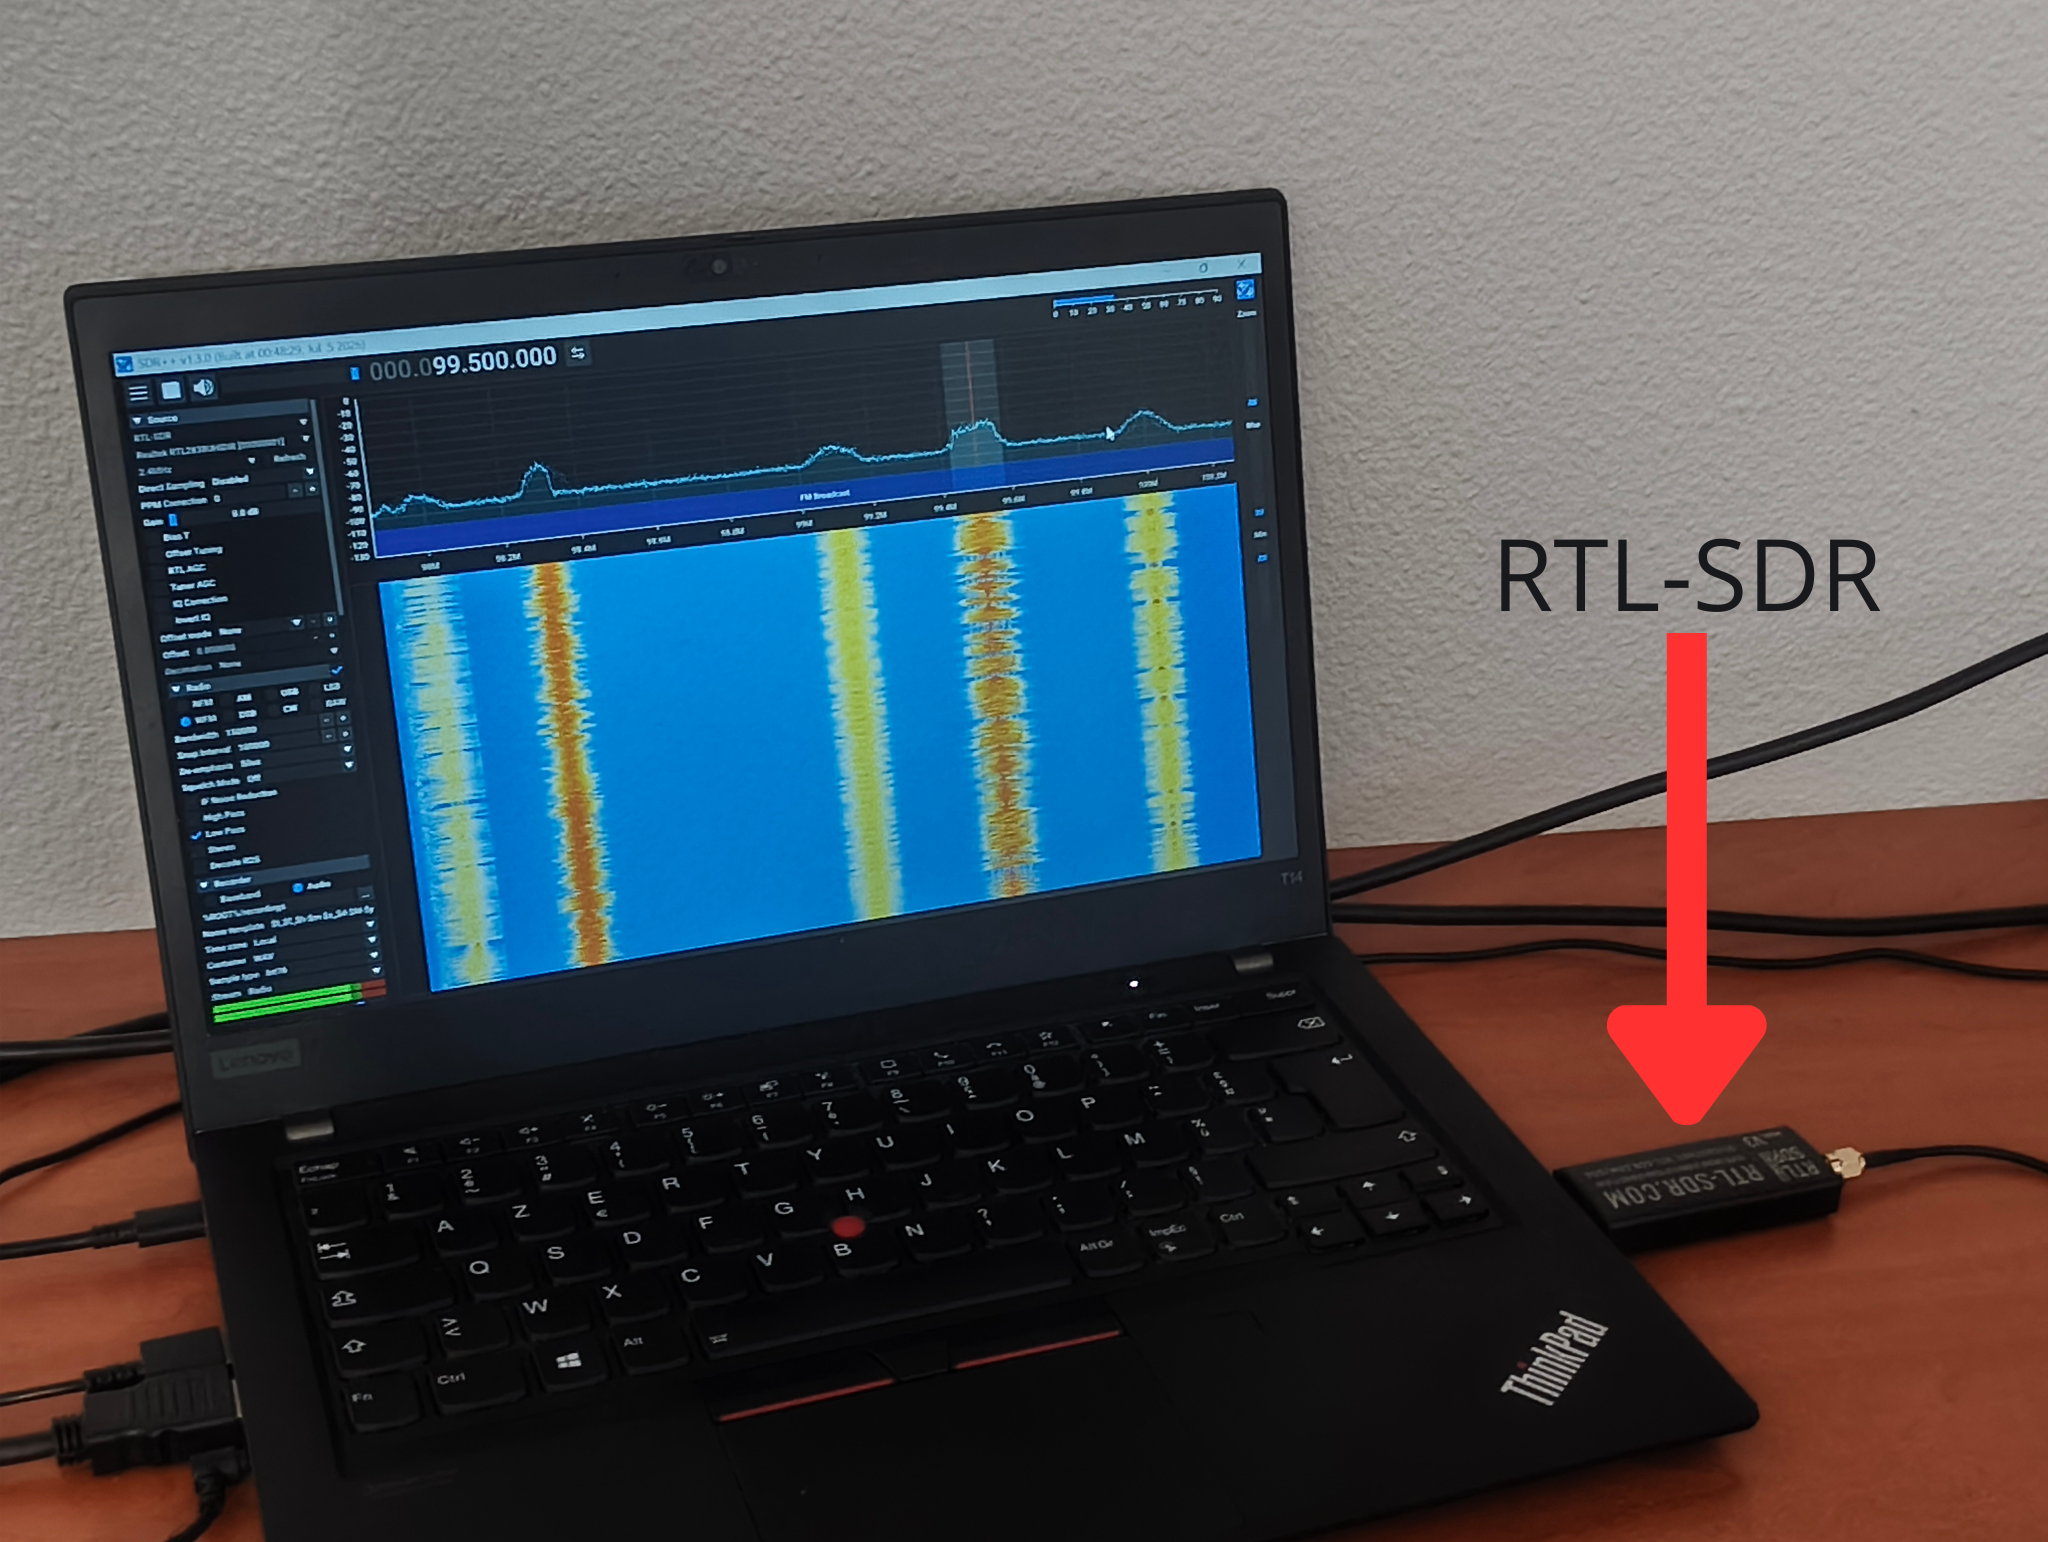
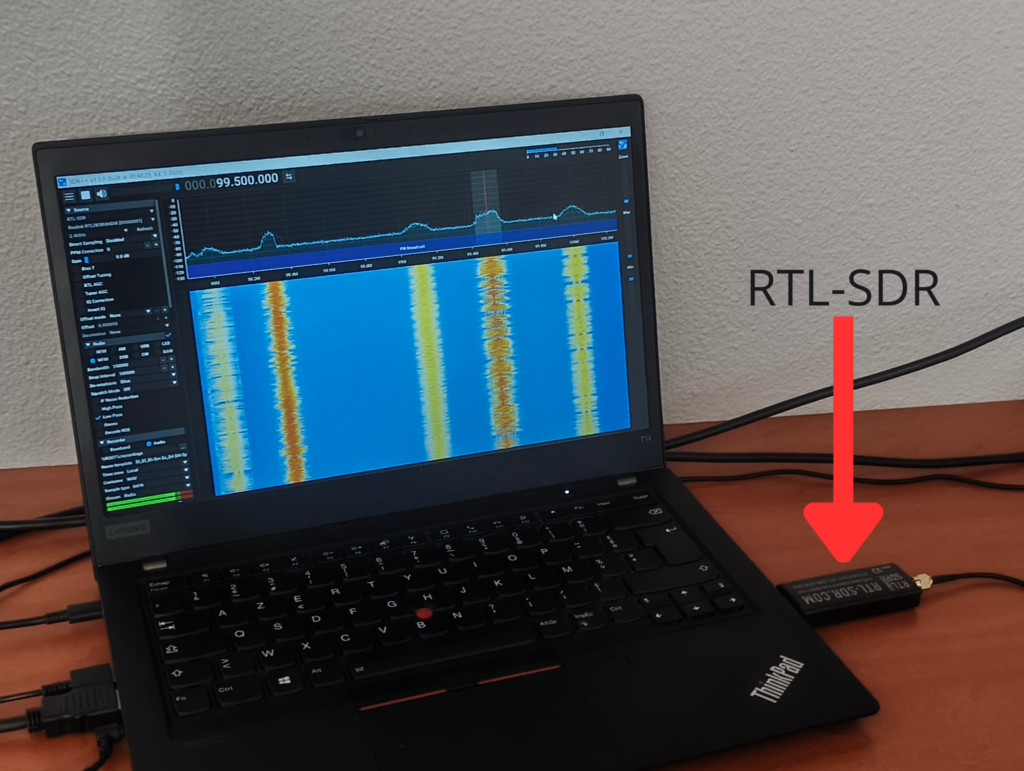
Laptop with SDR++ ( Software) and RTL-SDR (Hardware)
Antenna
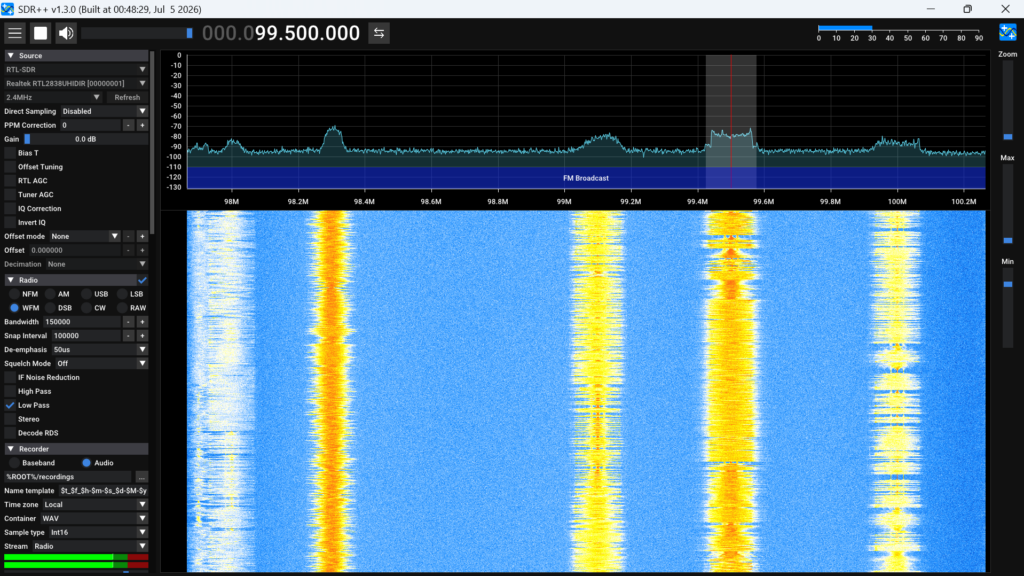
View of SDR++
I was able to listen to FM, and to change the bandwidth to match the bandwidth of the signal.
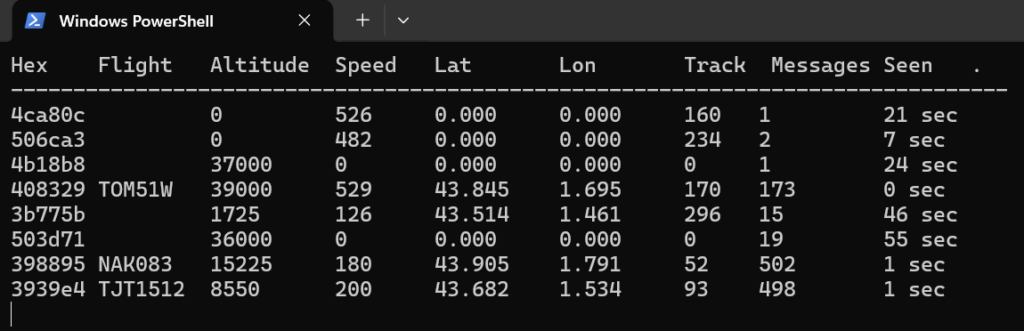
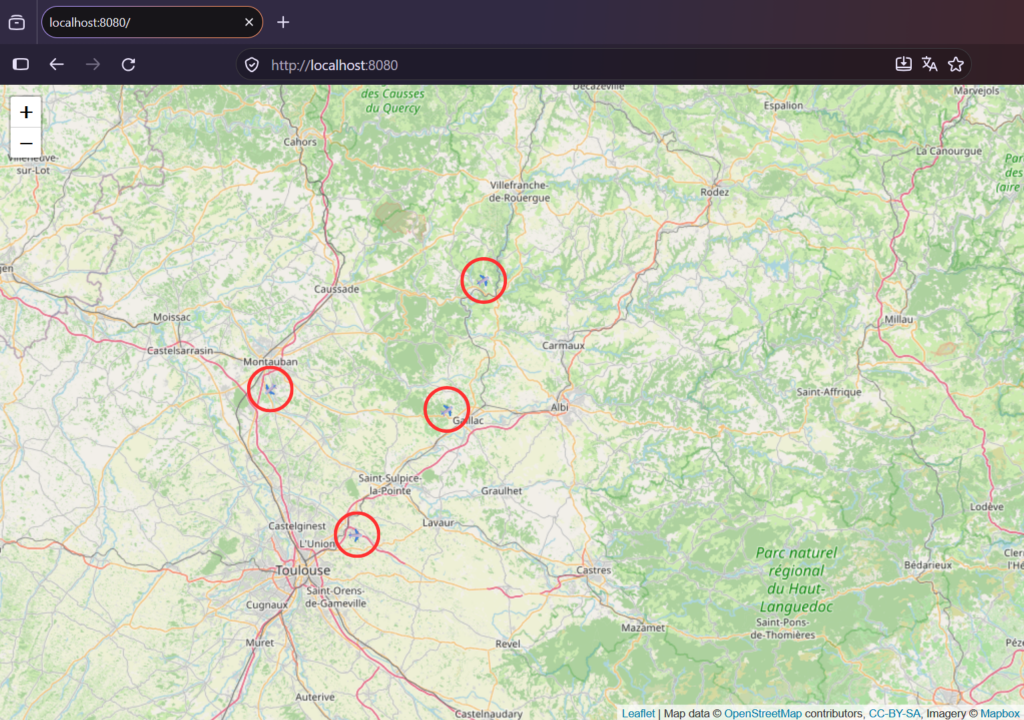
After FM I wanted to try to receive ADS-B messages. For this I used the software dump-1090. I modified the length of the antenna to match with the higher frequency. And I was able to receive some data as you can see below :
Information received about airplanes.Map with the positions of planes received.
These small experiments were interesting. I am motivated to learn more and maybe get a HAM radio license so that I could transmit signals and not only receive them.
During my preparatory class for engineering schools, I have decided to work on electronics and more specifically on power amplification for my mandatory personal project, that I presented for the competive exams.
This choice was motivated by my interest in radiocommunication, especially ham radio, and how to make sure our correspondant had a good reception of our message.
My goal with this project was to improve the linearity of a class B amplifier. Indeed, the signal is distorted when it is closed to small tension due to the saturation tension of the transistors.
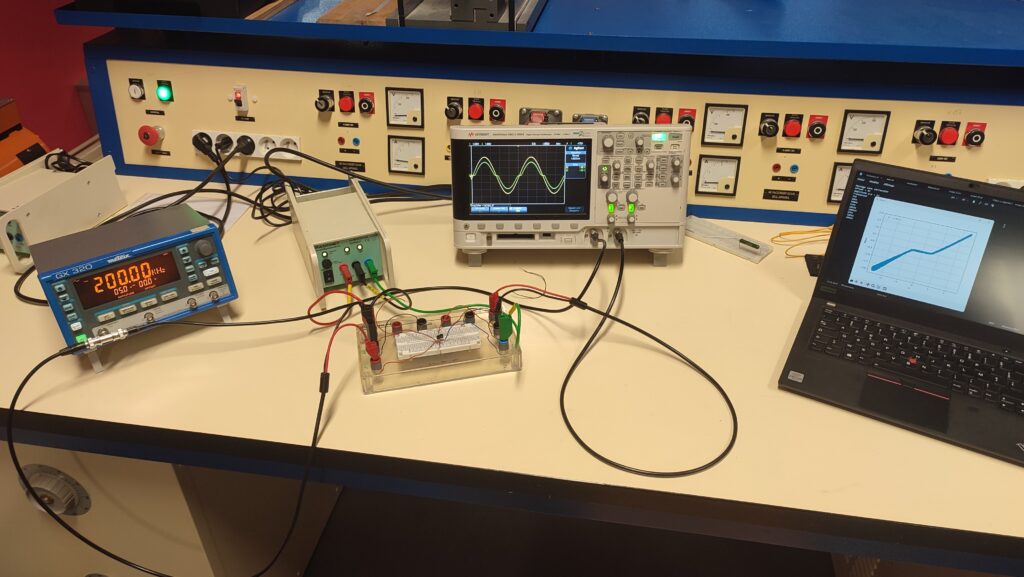
Picture of the bench work with all the equipment (Signal generator, Power Supply, Oscilloscope …)
I have done some research and found out multiple circuit that could solve this issue. I ended up focusing on polarisations diodes and a circuit with an operational amplifier.
I have made simulation to verify that these circuits will erase the non linearity. After, I made the circuits on a breadboard and mesure the output with an oscilloscope.
I saved the sampling of the oscilloscope in CSV file and later analyse it with a Python script. This script was able to plot different type of graph (temporal, XY, frequency spectrum) for multiple files in a folder. I even made a small graphical interface using Tkinter. I have used AI in order to help to make the function plotting the data. It saved me a lot of time not looking in the documentation.
To compare the different circuit, I calculated THD (Total Harmonic Distorsion) for the multiple frequencies I measured.
This project made me develops many technical skills, such as oscilloscope usage. But also soft skills, like communication as I needed to present my work at the end.